اطلاعیه

Collapse
No announcement yet.

detect color wavelet image

Collapse
X
 
  • فیلتر
  • زمان
  • Show
Clear All
new posts

    detect color wavelet image

    clc;clear all;close all
    I = imread('c:\ROI\mdb196.tif'
    [cA,cH,cV,cD] = dwt2(I,'haar','mode','sym '
    colormap(hsv(255));
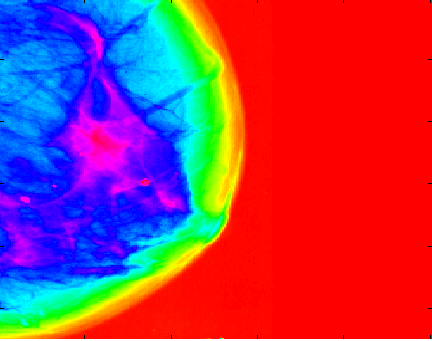
    imagesc(cA); title('Lowpass Approximation'

    :cry2:من می خوام قسمت صورتی که در ویولت نشان داده شده است دورش خط کشیده شود برای تصاویر مختلف این منطقه تغییر می کند نمونه تصویر ضمیمه شد.
    نمونه تصویر اول
    http://s6.picofile.com/file/8200539000/mdb231.tif.html
    نمونه تصویر دوم
    http://s3.picofile.com/file/8200539068/mdb196.tif.html
    تصویر ویولت


    لطفا کمکم کنید مهم هست برام

    #2
    پاسخ : detect color wavelet image

    لطفا اگه میشه من راهنمایی کنید :cry: :cry2:

    دیدگاه


      #3
      پاسخ : detect color wavelet image

      یعنی هیچکی بلد نیس

      اینم یه نمونه برنامه

      لطفا عجله کنید

      % HSV (Hue, Saturation, Value) color space.
      % Requires the Image Processing Toolbox. Developed under MATLAB R2010a.
      % by ImageAnalyst
      function SimpleColorDetectionByHue()
      clc; % Clear command window.
      clear; % Delete all variables.
      close all; % Close all figure windows except those created by imtool.
      imtool close all; % Close all figure windows created by imtool.
      workspace; % Make sure the workspace panel is showing.

      % Change the current folder to the folder of this m-file.
      % (The "cd" line of code below is from Brett Shoelson of The Mathworks.)
      if(~isdeployed)
      cd(fileparts(which(mfilename))); % From Brett
      end

      ver % Display user's toolboxes in their command window.

      % Introduce the demo, and ask user if they want to continue or exit.
      message = sprintf('This demo will illustrate very simple yellow color detection\nin HSV color space.\nIt requires the Image Processing Toolbox.\nDo you wish to continue?'
      reply = questdlg(message, 'Run Demo?', 'OK','Cancel', 'OK'
      if strcmpi(reply, 'Cancel&#039
      % User canceled so exit.
      return;
      end

      try
      % Check that user has the Image Processing Toolbox installed.
      versionInfo = ver; % Capture their toolboxes in the variable.
      hasIPT = false;
      for k = 1:length(versionInfo)
      if strcmpi(versionInfo(k).Name, 'Image Processing Toolbox&#039 > 0
      hasIPT = true;
      end
      end
      if ~hasIPT
      % User does not have the toolbox installed.
      message = sprintf('Sorry, but you do not seem to have the Image Processing Toolbox.\nDo you want to try to continue anyway?'
      reply = questdlg(message, 'Toolbox missing', 'Yes', 'No', 'Yes'
      if strcmpi(reply, 'No&#039
      % User said No, so exit.
      return;
      end
      end

      % Continue with the demo. Do some initialization stuff.
      close all;
      fontSize = 16;
      figure;
      % Maximize the figure.
      set(gcf, 'Position', get(0, 'ScreenSize&#039);

      % Change the current folder to the folder of this m-file.
      % (The line of code below is from Brett Shoelson of The Mathworks.)
      if(~isdeployed)
      cd(fileparts(which(mfilename)));
      end

      % Ask user if they want to use a demo image or their own image.
      message = sprintf('Do you want use a standard demo image,\nOr pick one of your own?'
      reply2 = questdlg(message, 'Which Image?', 'Demo','My Own', 'Demo'
      % Open an image.
      if strcmpi(reply2, 'Demo&#039
      % Read standard MATLAB demo image.
      % fullImageFileName = 'peppers.png';
      message = sprintf('Which demo image do you want to use?'
      selectedImage = questdlg(message, 'Which Demo Image?', 'Onions', 'Peppers', 'Kids', 'Onions'
      if strcmp(selectedImage, 'Onions&#039
      fullImageFileName = 'onion.png';
      elseif strcmp(selectedImage, 'Peppers&#039
      fullImageFileName = 'peppers.png';
      else
      fullImageFileName = 'kids.tif';
      end
      else
      % They want to pick their own.
      % Change default directory to the one containing the standard demo images for the MATLAB Image Processing Toolbox.
      originalFolder = pwd;
      folder = 'C:\Program Files\MATLAB\R2010a\toolbox\images\imdemos';
      if ~exist(folder, 'dir&#039
      folder = pwd;
      end
      cd(folder);
      % Browse for the image file.
      [baseFileName, folder] = uigetfile('*.*', 'Specify an image file'
      fullImageFileName = fullfile(folder, baseFileName);
      % Set current folder back to the original one.
      cd(originalFolder);
      selectedImage = 'My own image'; % Need for the if threshold selection statement later.

      end

      % Check to see that the image exists. (Mainly to check on the demo images.)
      if ~exist(fullImageFileName, 'file&#039
      message = sprintf('This file does not exist:\n%s', fullImageFileName);
      uiwait(msgbox(message));
      return;
      end

      % Read in image into an array.
      [rgbImage storedColorMap] = imread(fullImageFileName);
      [rows columns numberOfColorBands] = size(rgbImage);
      % If it's monochrome (indexed), convert it to color.
      % Check to see if it's an 8-bit image needed later for scaling).
      if strcmpi(class(rgbImage), 'uint8&#039
      % Flag for 256 gray levels.
      eightBit = true;
      else
      eightBit = false;
      end
      if numberOfColorBands == 1
      if isempty(storedColorMap)
      % Just a simple gray level image, not indexed with a stored color map.
      % Create a 3D true color image where we copy the monochrome image into all 3 (R, G, & B) color planes.
      rgbImage = cat(3, rgbImage, rgbImage, rgbImage);
      else
      % It's an indexed image.
      rgbImage = ind2rgb(rgbImage, storedColorMap);
      % ind2rgb() will convert it to double and normalize it to the range 0-1.
      % Convert back to uint8 in the range 0-255, if needed.
      if eightBit
      rgbImage = uint8(255 * rgbImage);
      end
      end
      end

      % Display the original image.
      subplot(3, 4, 1);
      imshow(rgbImage);
      drawnow; % Make it display immediately.
      if numberOfColorBands > 1
      title('Original Color Image', 'FontSize', fontSize);
      else
      caption = sprintf('Original Indexed Image\n(converted to true color with its stored colormap)'
      title(caption, 'FontSize', fontSize);
      end

      % Convert RGB image to HSV
      hsvImage = rgb2hsv(rgbImage);
      % Extract out the H, S, and V images individually
      hImage = hsvImage(:,:,1);
      sImage = hsvImage(:,:,2);
      vImage = hsvImage(:,:,3);

      % Display them.
      subplot(3, 4, 2);
      imshow(hImage);
      title('Hue Image', 'FontSize', fontSize);
      subplot(3, 4, 3);
      imshow(sImage);
      title('Saturation Image', 'FontSize', fontSize);
      subplot(3, 4, 4);
      imshow(vImage);
      title('Value Image', 'FontSize', fontSize);
      message = sprintf('These are the individual HSV color bands.\nNow we will compute the image histograms.'
      reply = questdlg(message, 'Continue with Demo?', 'OK','Cancel', 'OK'
      if strcmpi(reply, 'Cancel&#039
      % User canceled so exit.
      return;
      end

      % Compute and plot the histogram of the "hue" band.
      hHuePlot = subplot(3, 4, 6);
      [hueCounts, hueBinValues] = imhist(hImage);
      maxHueBinValue = find(hueCounts > 0, 1, 'last'
      maxCountHue = max(hueCounts);
      bar(hueBinValues, hueCounts, 'r'
      grid on;
      xlabel('Hue Value'
      ylabel('Pixel Count'
      title('Histogram of Hue Image', 'FontSize', fontSize);

      % Compute and plot the histogram of the "saturation" band.
      hSaturationPlot = subplot(3, 4, 7);
      [saturationCounts, saturationBinValues] = imhist(sImage);
      maxSaturationBinValue = find(saturationCounts > 0, 1, 'last'
      maxCountSaturation = max(saturationCounts);
      bar(saturationBinValues, saturationCounts, 'g', 'BarWidth', 0.95);
      grid on;
      xlabel('Saturation Value'
      ylabel('Pixel Count'
      title('Histogram of Saturation Image', 'FontSize', fontSize);

      % Compute and plot the histogram of the "value" band.
      hValuePlot = subplot(3, 4, 8);
      [valueCounts, valueBinValues] = imhist(vImage);
      maxValueBinValue = find(valueCounts > 0, 1, 'last'
      maxCountValue = max(valueCounts);
      bar(valueBinValues, valueCounts, 'b'
      grid on;
      xlabel('Value Value'
      ylabel('Pixel Count'
      title('Histogram of Value Image', 'FontSize', fontSize);

      % Set all axes to be the same width and height.
      % This makes it easier to compare them.
      maxCount = max([maxCountHue, maxCountSaturation, maxCountValue]);
      axis([hHuePlot hSaturationPlot hValuePlot], [0 1 0 maxCount]);

      % Plot all 3 histograms in one plot.
      subplot(3, 4, 5);
      plot(hueBinValues, hueCounts, 'r', 'LineWidth', 2);
      grid on;
      xlabel('Values'
      ylabel('Pixel Count'
      hold on;
      plot(saturationBinValues, saturationCounts, 'g', 'LineWidth', 2);
      plot(valueBinValues, valueCounts, 'b', 'LineWidth', 2);
      title('Histogram of All Bands', 'FontSize', fontSize);
      maxGrayLevel = max([maxHueBinValue, maxSaturationBinValue, maxValueBinValue]);
      % Make x-axis to just the max gray level on the bright end.
      xlim([0 1]);

      % Now select thresholds for the 3 color bands.
      message = sprintf('Now we will select some color threshold ranges\nand display them over the histograms.'
      reply = questdlg(message, 'Continue with Demo?', 'OK','Cancel', 'OK'
      if strcmpi(reply, 'Cancel&#039
      % User canceled so exit.
      return;
      end

      % Assign the low and high thresholds for each color band.
      if strcmpi(reply2, 'My Own&#039 || strcmpi(selectedImage, 'Kids&#039 > 0
      % Take a guess at the values that might work for the user's image.
      hueThresholdLow = 0;
      hueThresholdHigh = graythresh(hImage);
      saturationThresholdLow = graythresh(sImage);
      saturationThresholdHigh = 1.0;
      valueThresholdLow = graythresh(vImage);
      valueThresholdHigh = 1.0;
      else
      % Use values that I know work for the onions and peppers demo images.
      hueThresholdLow = 0.10;
      hueThresholdHigh = 0.14;
      saturationThresholdLow = 0.4;
      saturationThresholdHigh = 1;
      valueThresholdLow = 0.8;
      valueThresholdHigh = 1.0;
      end

      % Show the thresholds as vertical red bars on the histograms.
      PlaceThresholdBars(6, hueThresholdLow, hueThresholdHigh);
      PlaceThresholdBars(7, saturationThresholdLow, saturationThresholdHigh);
      PlaceThresholdBars(8, valueThresholdLow, valueThresholdHigh);

      message = sprintf('Next we will apply each color band threshold range to its respective color band.'
      reply = questdlg(message, 'Continue with Demo?', 'OK','Cancel', 'OK'
      if strcmpi(reply, 'Cancel&#039
      % User canceled so exit.
      return;
      end

      % Now apply each color band's particular thresholds to the color band
      hueMask = (hImage >= hueThresholdLow) & (hImage <= hueThresholdHigh);
      saturationMask = (sImage >= saturationThresholdLow) & (sImage <= saturationThresholdHigh);
      valueMask = (vImage >= valueThresholdLow) & (vImage <= valueThresholdHigh);

      % Display the thresholded binary images.
      fontSize = 16;
      subplot(3, 4, 10);
      imshow(hueMask, []);
      title('= Hue Mask', 'FontSize', fontSize);
      subplot(3, 4, 11);
      imshow(saturationMask, []);
      title('& Saturation Mask', 'FontSize', fontSize);
      subplot(3, 4, 12);
      imshow(valueMask, []);
      title('& Value Mask', 'FontSize', fontSize);
      % Combine the masks to find where all 3 are "true."
      % Then we will have the mask of only the red parts of the image.
      yellowObjectsMask = uint8(hueMask & saturationMask & valueMask);
      subplot(3, 4, 9);
      imshow(yellowObjectsMask, []);
      caption = sprintf('Mask of Only\nThe Yellow Objects'
      title(caption, 'FontSize', fontSize);

      % Tell user that we're going to filter out small objects.
      smallestAcceptableArea = 100; % Keep areas only if they're bigger than this.
      message = sprintf('Note the small regions in the image in the lower left.\nNext we will eliminate regions smaller than %d pixels.', smallestAcceptableArea);
      reply = questdlg(message, 'Continue with Demo?', 'OK','Cancel', 'OK'
      if strcmpi(reply, 'Cancel&#039
      % User canceled so exit.
      return;
      end

      % Open up a new figure, since the existing one is full.
      figure;
      % Maximize the figure.
      set(gcf, 'Position', get(0, 'ScreenSize&#039);

      % Get rid of small objects. Note: bwareaopen returns a logical.
      yellowObjectsMask = uint8(bwareaopen(yellowObjectsMask, smallestAcceptableArea));
      subplot(3, 3, 1);
      imshow(yellowObjectsMask, []);
      fontSize = 13;
      caption = sprintf('bwareaopen() removed objects\nsmaller than %d pixels', smallestAcceptableArea);
      title(caption, 'FontSize', fontSize);

      % Smooth the border using a morphological closing operation, imclose().
      structuringElement = strel('disk', 4);
      yellowObjectsMask = imclose(yellowObjectsMask, structuringElement);
      subplot(3, 3, 2);
      imshow(yellowObjectsMask, []);
      fontSize = 16;
      title('Border smoothed', 'FontSize', fontSize);

      % Fill in any holes in the regions, since they are most likely red also.
      yellowObjectsMask = uint8(imfill(yellowObjectsMask, 'holes&#039);
      subplot(3, 3, 3);
      imshow(yellowObjectsMask, []);
      title('Regions Filled', 'FontSize', fontSize);

      message = sprintf('This is the filled, size-filtered mask.\nNext we will apply this mask to the original RGB image.'
      reply = questdlg(message, 'Continue with Demo?', 'OK','Cancel', 'OK'
      if strcmpi(reply, 'Cancel&#039
      % User canceled so exit.
      return;
      end

      % You can only multiply integers if they are of the same type.
      % (yellowObjectsMask is a logical array.)
      % We need to convert the type of yellowObjectsMask to the same data type as hImage.
      yellowObjectsMask = cast(yellowObjectsMask, class(rgbImage));

      % Use the yellow object mask to mask out the yellow-only portions of the rgb image.
      maskedImageR = yellowObjectsMask .* rgbImage(:,:,1);
      maskedImageG = yellowObjectsMask .* rgbImage(:,:,2);
      maskedImageB = yellowObjectsMask .* rgbImage(:,:,3);
      % Show the masked off red image.
      subplot(3, 3, 4);
      imshow(maskedImageR);
      title('Masked Red Image', 'FontSize', fontSize);
      % Show the masked off saturation image.
      subplot(3, 3, 5);
      imshow(maskedImageG);
      title('Masked Green Image', 'FontSize', fontSize);
      % Show the masked off value image.
      subplot(3, 3, 6);
      imshow(maskedImageB);
      title('Masked Blue Image', 'FontSize', fontSize);
      % Concatenate the masked color bands to form the rgb image.
      maskedRGBImage = cat(3, maskedImageR, maskedImageG, maskedImageB);
      % Show the masked off, original image.
      subplot(3, 3, 8);
      imshow(maskedRGBImage);
      fontSize = 13;
      caption = sprintf('Masked Original Image\nShowing Only the Yellow Objects'
      title(caption, 'FontSize', fontSize);
      % Show the original image next to it.
      subplot(3, 3, 7);
      imshow(rgbImage);
      title('The Original Image (Again)', 'FontSize', fontSize);

      % Measure the mean HSV and area of all the detected blobs.
      [meanHSV, areas, numberOfBlobs] = MeasureBlobs(yellowObjectsMask, hImage, sImage, vImage);
      if numberOfBlobs > 0
      fprintf(1, '\n----------------------------------------------\n'
      fprintf(1, 'Blob #, Area in Pixels, Mean H, Mean S, Mean V\n'
      fprintf(1, '----------------------------------------------\n'
      for blobNumber = 1 : numberOfBlobs
      fprintf(1, '#%5d, %14d, %6.2f, %6.2f, %6.2f\n', blobNumber, areas(blobNumber), ...
      meanHSV(blobNumber, 1), meanHSV(blobNumber, 2), meanHSV(blobNumber, 3));
      end
      else
      % Alert user that no yellow blobs were found.
      message = sprintf('No yellow blobs were found in the image:\n%s', fullImageFileName);
      fprintf(1, '\n%s\n', message);
      uiwait(msgbox(message));
      end

      subplot(3, 3, 9);
      ShowCredits();
      message = sprintf('Done!\n\nThe demo has finished.\n\nLook the MATLAB command window for\nthe area and color measurements of the %d regions.', numberOfBlobs);
      msgbox(message);

      catch ME
      errorMessage = sprintf('Error running this m-file:\n%s\n\nThe error message is:\n%s', ...
      mfilename('fullpath&#039, ME.message);
      errordlg(errorMessage);
      end
      return; % from SimpleColorDetection()
      % ---------- End of main function ---------------------------------


      %----------------------------------------------------------------------------
      function [meanHSV, areas, numberOfBlobs] = MeasureBlobs(maskImage, hImage, sImage, vImage)
      [labeledImage numberOfBlobs] = bwlabel(maskImage, 8); % Label each blob so we can make measurements of it
      if numberOfBlobs == 0
      % Didn't detect any yellow blobs in this image.
      meanHSV = [0 0 0];
      areas = 0;
      return;
      end
      % Get all the blob properties. Can only pass in originalImage in version R2008a and later.
      blobMeasurementsHue = regionprops(labeledImage, hImage, 'area', 'MeanIntensity'
      blobMeasurementsSat = regionprops(labeledImage, sImage, 'area', 'MeanIntensity'
      blobMeasurementsValue = regionprops(labeledImage, vImage, 'area', 'MeanIntensity'

      meanHSV = zeros(numberOfBlobs, 3); % One row for each blob. One column for each color.
      meanHSV(:,1) = [blobMeasurementsHue.MeanIntensity]';
      meanHSV(:,2) = [blobMeasurementsSat.MeanIntensity]';
      meanHSV(:,3) = [blobMeasurementsValue.MeanIntensity]';

      % Now assign the areas.
      areas = zeros(numberOfBlobs, 3); % One row for each blob. One column for each color.
      areas(:,1) = [blobMeasurementsHue.Area]';
      areas(:,2) = [blobMeasurementsSat.Area]';
      areas(:,3) = [blobMeasurementsValue.Area]';

      return; % from MeasureBlobs()


      %----------------------------------------------------------------------------
      % Function to show the low and high threshold bars on the histogram plots.
      function PlaceThresholdBars(plotNumber, lowThresh, highThresh)
      % Show the thresholds as vertical red bars on the histograms.
      subplot(3, 4, plotNumber);
      hold on;
      maxYValue = ylim;
      maxXValue = xlim;
      hStemLines = stem([lowThresh highThresh], [maxYValue(2) maxYValue(2)], 'r'
      children = get(hStemLines, 'children'
      set(children(2),'visible', 'off'
      % Place a text label on the bar chart showing the threshold.
      fontSizeThresh = 14;
      annotationTextL = sprintf('%d', lowThresh);
      annotationTextH = sprintf('%d', highThresh);
      % For text(), the x and y need to be of the data class "double" so let's cast both to double.
      text(double(lowThresh + 5), double(0.85 * maxYValue(2)), annotationTextL, 'FontSize', fontSizeThresh, 'Color', [0 .5 0], 'FontWeight', 'Bold'
      text(double(highThresh + 5), double(0.85 * maxYValue(2)), annotationTextH, 'FontSize', fontSizeThresh, 'Color', [0 .5 0], 'FontWeight', 'Bold'

      % Show the range as arrows.
      % Can't get it to work, with either gca or gcf.
      % annotation(gca, 'arrow', [lowThresh/maxXValue(2) highThresh/maxXValue(2)],[0.7 0.7]);

      return; % from PlaceThresholdBars()


      %----------------------------------------------------------------------------
      % Display the MATLAB logo.
      function ShowCredits()
      % xpklein;
      % surf(peaks(30));
      logoFig = subplot(3,3,9);
      caption = sprintf('A MATLAB Demo\nby ImageAnalyst'
      text(0.5,1.15, caption, 'Color','r', 'FontSize', 18, 'FontWeight','b', 'HorizontalAlignment', 'Center&#039 ;
      positionOfLowerRightPlot = get(logoFig, 'position'
      L = 40*membrane(1,25);
      logoax = axes('CameraPosition', [-193.4013 -265.1546 220.4819],...
      'CameraTarget',[26 26 10], ...
      'CameraUpVector',[0 0 1], ...
      'CameraViewAngle',9.5, ...
      'DataAspectRatio', [1 1 .9],...
      'Position', positionOfLowerRightPlot, ...
      'Visible','off', ...
      'XLim',[1 51], ...
      'YLim',[1 51], ...
      'ZLim',[-13 40], ...
      'parent',gcf);
      s = surface(L, ...
      'EdgeColor','none', ...
      'FaceColor',[0.9 0.2 0.2], ...
      'FaceLighting','phong', ...
      'AmbientStrength',0.3, ...
      'DiffuseStrength',0.6, ...
      'Clipping','off',...
      'BackFaceLighting','lit', ...
      'SpecularStrength',1.1, ...
      'SpecularColorReflectance',1, ...
      'SpecularExponent',7, ...
      'Tag','TheMathWorksLogo', ...
      'parent',logoax);
      l1 = light('Position',[40 100 20], ...
      'Style','local', ...
      'Color',[0 0.8 0.8], ...
      'parent',logoax);
      l2 = light('Position',[.5 -1 .4], ...
      'Color',[0.8 0.8 0], ...
      'parent',logoax);

      return; % from ShowCredits()

      دیدگاه


        #4
        پاسخ : detect color wavelet image

        سلام
        کدی که گذاشتین از استانه گذاری روی محیط اچ و اس و وی استفاده می کنه
        ولی نتونست رنگ زرد که مثال خودش بود رو حتی به خوبی بدست بیاره!!!!
        سوالتون چیه؟؟
        انجمن پرسش و پاسخ مهندسی پزشکی
        http://biomedeng.ir/forum_per/
        +++++++++++++++++++++++++++++++++
        سایت مهندسی پزشکی
        http://biomedeng.ir/

        دیدگاه

        لطفا صبر کنید...
        X